
Trigonometric Functions. Modelling Periodic Functions
Lesson 8: Trigonometric Functions. Modelling Periodic Functions
Graph sine and cosine functions and model periodic situations.
Trigonometric functions are functions that model periodic phenomena. They are based on a repeating event, therefore we use a circle, angles and trigonometric ratios to define and represent a trigonometric function. Trigonometric functions can model relationships between different quantities that follow a periodic nature: height over time, distance over time, temperature over time and so on.
The main types of trigonometric functions are based on the primary trigonometric ratios of sine, cosine and tangent. The sine and cosine functions are most frequently used to model real life periodic events.
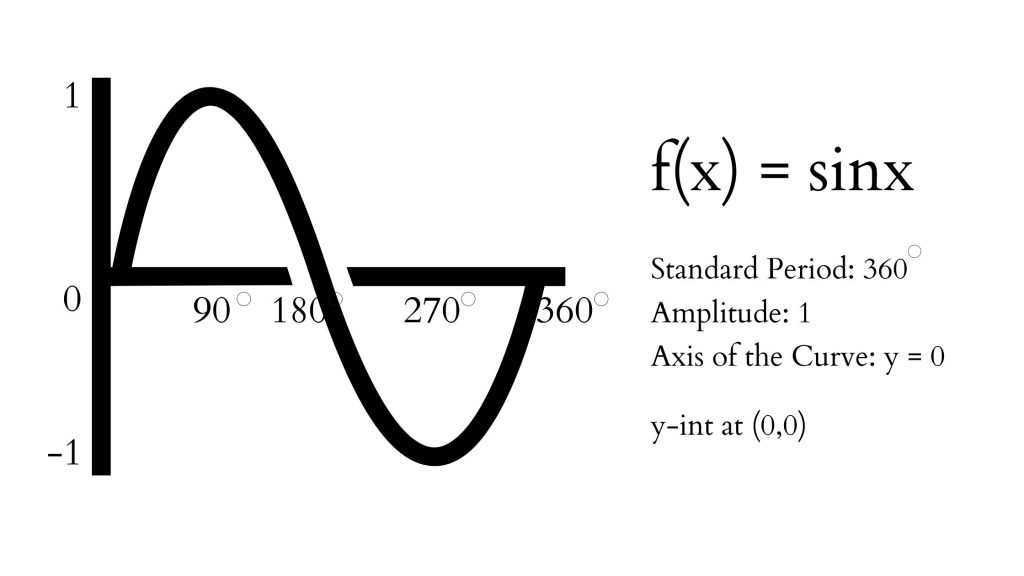
Sine Function has the following characteristics and graph:
Domain: {x ∈ R}, Range: {y ∈ R| -1≤ y ≤ 1}
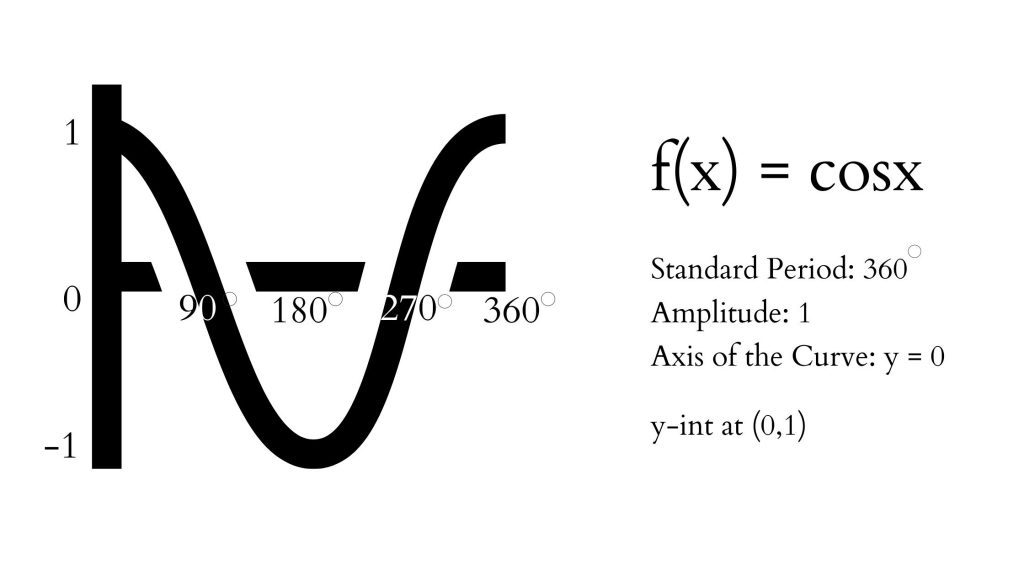
Cosine Function has the following graph and characteristics:
Domain: {x ∈ R}, Range: {y ∈ R|-1 ≤ y ≤ 1}
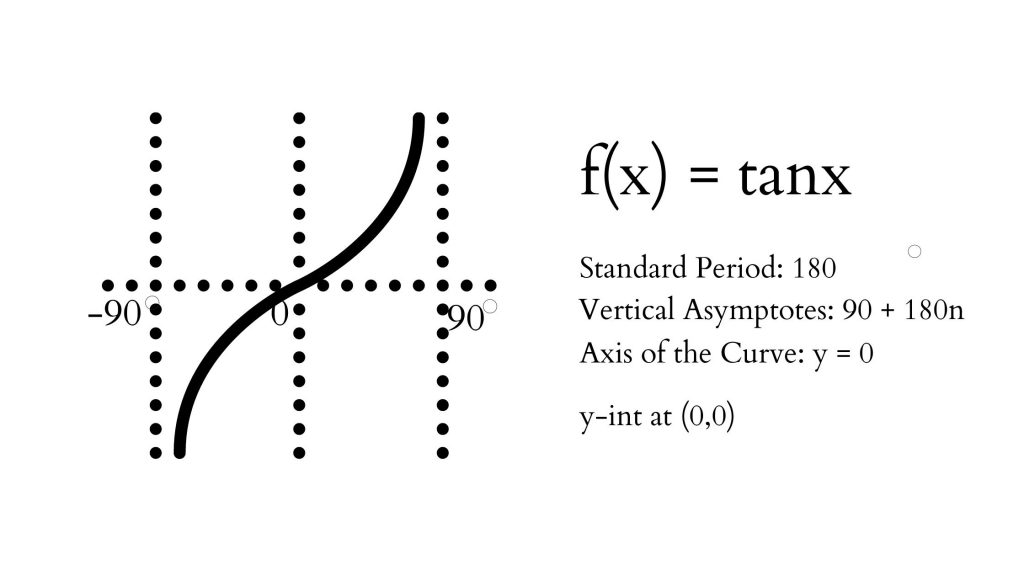
Tangent Function has the following graph and characteristics
Domain: {x ∈ R| x ≠ 90 + 180n}, Range: {y ∈ R}
Transformations of Trigonometric Functions
Above you have observed the parent trigonometric functions. But every function can be transformed.
Periodic functions have the following general equation that describes possible transformations (sin function could be replaced by cos or tan functions) :
f(x) = asin(k(x – d))+c
- a – amplitude and reflection in the x-axis if negative
- k – determines the period of a function: P = Standard Period/k
- d – phase shift left or right
- c – vertical shift, determine the equation of the axis of the curve: y = c
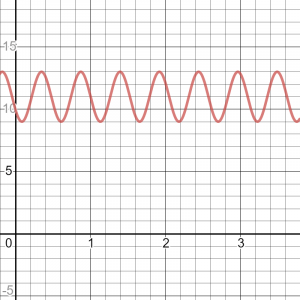
Example: f(x) = -2sin(12(x – 1)) + 11
- a = 2, reflection in the x-axis
- k = 12, so Period = 360/12 = 30
- d = 1, so phase shift 1 unit to the right
- c = 11, so AoC is y = 11
- max value is 13, min value is 9
Applications of Trigonometric Functions
Trigonometric functions can be used to model a variety of situations that are periodic.
For example, seasons change periodically, heart beats periodically, a wheel rotates or a wave moves also periodically.
Periodic behaviour is when something repeats over and over and over again over the same period and resulting in the same outputs each time.
Check out the video lesson below explaining how certain events can be described as periodic functions. Learn how to graph and find equations of the trigonometric functions based on the information provided.
Key ideas: Trigonometric Functions. Modelling Periodic Functions
For y = a sin[k(x − d)] + c (or cos):
- Amplitude = |a| = (max − min)/2
- Period = 360°/|k|
- Phase shift = d (right if d > 0)
- Axis (equation of the axis) y = c = (max + min)/2. Maximum = c + |a|, minimum = c − |a|.
Worked examples
Example 1
State the properties of y = 3 sin[2(x − 30°)] + 1.
- Amplitude 3; period 360°/2 = 180°; phase shift 30° right; axis y = 1.
- Maximum 1 + 3 = 4, minimum 1 − 3 = −2.
Example 2
A Ferris wheel has diameter 20 m, its centre is 12 m above the ground, it turns once every 40 s, and you board at the bottom. Model your height.
- Amplitude 10 (the radius), axis y = 12, period 40 s so k = 360/40 = 9.
- Starting at the minimum suggests a reflected cosine: h(t) = −10 cos(9t) + 12 (t in seconds, angle in degrees).
- Check: h(0) = 2 m (bottom), h(10) = 12 m (level with the centre), h(20) = 22 m (top) ✓
Example 3
A sine graph has maximum 5, minimum −1 and period 120°, and starts on its axis going up at x = 0. Find its equation.
- a = (5 − (−1))/2 = 3; c = (5 + (−1))/2 = 2; k = 360/120 = 3; d = 0.
- y = 3 sin(3x) + 2
Common mistakes
- Using k as the period; the period is 360°/k.
- Forgetting to factor out k before reading the phase shift: y = sin(2x − 60°) = sin[2(x − 30°)] has phase shift 30°, not 60°.
- Taking the amplitude as max − min instead of half of it.
Questions students ask
Sine or cosine: which should I use for a model?
Either works with the right phase shift. Cosine is convenient when the data starts at a maximum (or minimum, with a reflection); sine when it starts on the axis.
What real situations are periodic?
Tides, daylight hours over a year, Ferris wheels, sound waves and seasonal temperatures.
Check your understanding
Practise with the Grade 11 quizzes. You’ll see right away if each answer is correct.