
Exponential Functions. Transformations and Applications
Lesson 9: Exponential Functions. Transformations and Applications
Graph and transform exponential functions, with growth and decay.
Exponential functions are functions that model a very rapid growth or a very rapid decay of something. They are used to calculate finances, bacteria populations, the amount of chemical substance and much more.
In the exponential function the input is in the exponent. The base of the power determines whether the relation is a growth or a decay.
The graph of an exponential function is a curve that in a parent function form approaches, but never touches or crosses the x-axis. Thus, there is a horizontal asymptote of y = 0.
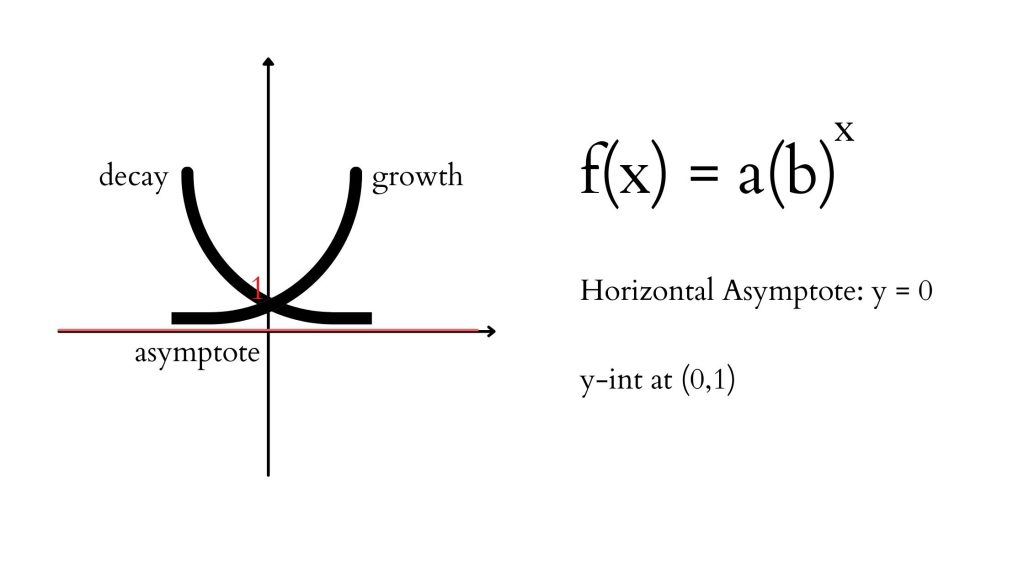
The horizontal asymptote exists because no positive base to any power (positive or negative) will result in a 0 or a negative output (for example, no matter what exponent you raise the base of 4 to, the result will never be 0 or something negative).
This also means that there will be a restriction on the range of the function (as the function is undefined at or below 0). This may change when you transform the function and add a reflection and/or vertical translation. There are no restrictions on the domain of the exponential function.
Transformations of Exponential Functions
Just like any other type of function, an exponential function can be transformed. It can be reflected, stretched and compressed, as well as shifted vertically and horizontally.
The general equation of an exponential function depicting transformations is the following:

- When a is negative, the function is reflected in the x-axis (affects the range of the function)
- When k is negative, the function is reflected in the y-axis
- When a is greater than 1, the function is vertically stretched
- When a is greater than 0 and less than 1, the function is vertically compressed
- When k is greater than 1, the function is horizontally compressed
- When k is greater than 0 and less than 1, the function is horizontally stretched
- When d is positive, move right; when d is negative, move left (opposite sign in brackets)
- When c is positive, move up; when c is negative, move down (affects the location of the horizontal asymptote)

Exponential Growth and Decay Word Problems
In real life exponential functions represent rapid growth and decay.
Watch how to solve word problem involving exponential growth and decay:
Another type of exponential function applications involves doubling period and half life. Watch how to solve doubling period and half life problems, including how to solve for an exponent:
Key ideas: Exponential Functions. Transformations and Applications
An exponential function has the form y = a(b)x with b > 0, b ≠ 1. If b > 1 it shows growth; if 0 < b < 1, decay. The graph has a horizontal asymptote (y = 0 before any vertical shift).
- Doubling: A = A0(2)t/d, where d is the doubling time.
- Half-life: A = A0(½)t/h, where h is the half-life.
- Compound interest: A = P(1 + i)n, with i the interest rate per period and n the number of periods.
- Transformations y = a·bk(x − d) + c work as for other functions; the asymptote becomes y = c.
Worked examples
Example 1
A culture starts with 500 bacteria and doubles every 3 h. How many are there after 12 h?
- N = 500(2)t/3.
- N = 500(2)12/3 = 500(2)4 = 8000 bacteria.
Example 2
A substance has a half-life of 6 days. How much of an 80 mg sample remains after 15 days?
- A = 80(½)15/6 = 80(½)2.5.
- A ≈ 14.1 mg
Example 3
$2000 is invested at 4% per year, compounded annually. What is it worth after 10 years?
- A = 2000(1.04)10.
- A ≈ $2960.49
Example 4
Describe y = −2(3)x − 1 + 4 and state its asymptote, y-intercept and range.
- Vertical stretch by 2, reflection in the x-axis, shift 1 right and 4 up.
- Asymptote y = 4. y-intercept: −2(3)−1 + 4 = 10/3.
- Because of the reflection the graph stays below the asymptote: range {y < 4}.
Common mistakes
- Using the percent as b: 4% growth means b = 1.04, not 4 or 0.04.
- Forgetting the t/d exponent in doubling and half-life problems.
- Thinking an exponential graph touches its asymptote; it only gets closer.
Questions students ask
How can I tell growth from decay in a table?
Divide each y-value by the one before it (equal x-steps). If the ratio is constant, the relation is exponential: a ratio above 1 is growth, below 1 is decay.
Why is the range limited?
A positive base to any power is always positive, so bx > 0; transformations move and flip that boundary, giving the asymptote.
Check your understanding
Practise with the Grade 11 quizzes. You’ll see right away if each answer is correct.