In math, diagrams and graphs are very important. Frequently, it is much easier to solve a problem, when there is a diagram. But sketching diagrams can be a challenge and math teachers are constantly looking for tools to help students with the process of creating a diagram. We have come across a really cool free tool – Sketchometry – that provides a convenient way to create diagrams on a device (can be download or used online). The created objects can be dragged and manipulated.
Is Sketchometry Easy To Use?
Yes, we have found that Sketchometry is quite an intuitive tool. The navigation bar is easy to locate and the symbols are obvious. It is a free tool with a variety of capabilities.
Sketchometry lets you sketch by hand or construct figures using geometric elements. It has a built in polygons tool, as well as angle construction and measuring tool.
Sketchometry has a graphing functionality. Like Desmos, it allows a user to input the function equation and graph it. It lets you set domain and range. It also allows you to construct and connect points on the graph first.
Here is how Sketchometry works
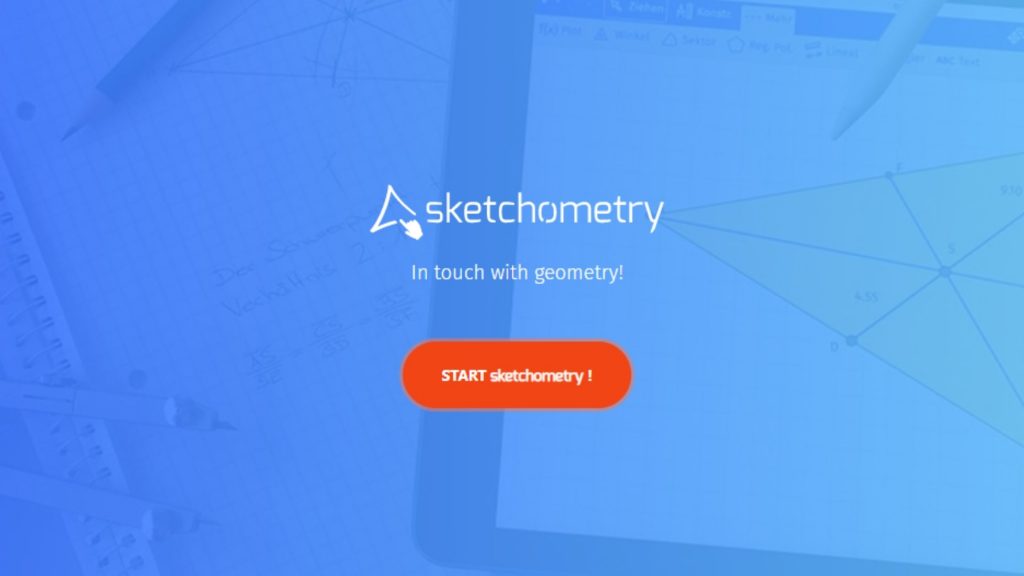
The Sketchometry home page looks quite self-explanatory. You click on “Start Sketchometry” and procced to the next page, where you would be creating your files:
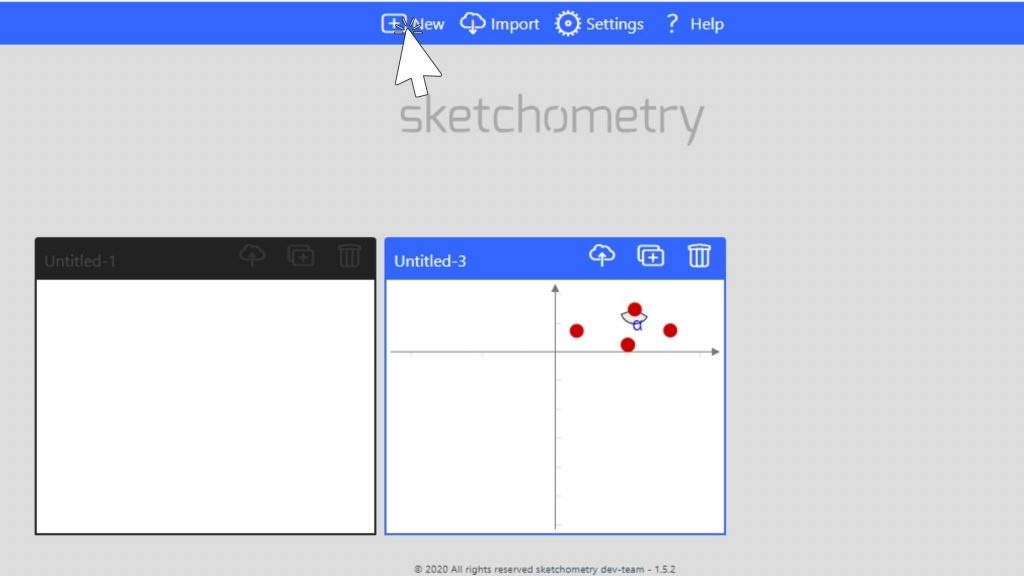
Once you are in Sketchometry, you can create a new file or upload an existing file. If you are new to Sketchometry, just create a new file to play with it and try all of the features of the tool:
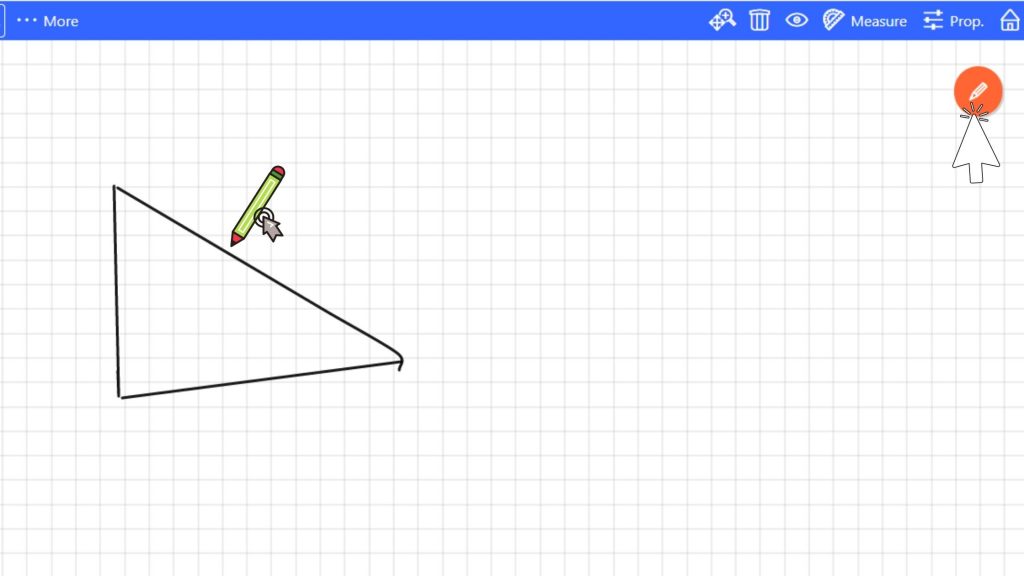
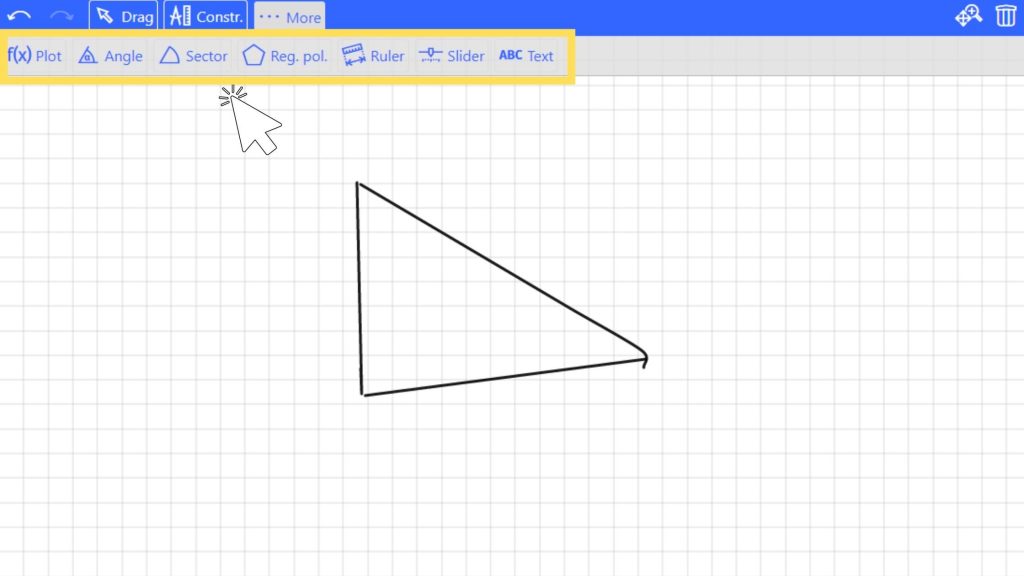
In order to draw something by hand or with a stylus, click on the pencil icon in the top right corner and make it turn orange, Then start sketching. When you wish to erase an element, click on the trash can icon and then on the element – the element will disappear.
In the top left corner, click “More…” and you will see all of the other features available: graphing a function, construction a polygon, constructing an angle, adding text etc.
Say, you wish to plot something – a point, a set of points, a graph – then click on “f(x) plot” icon and a cartesian plane will appear where you can do all of those things.
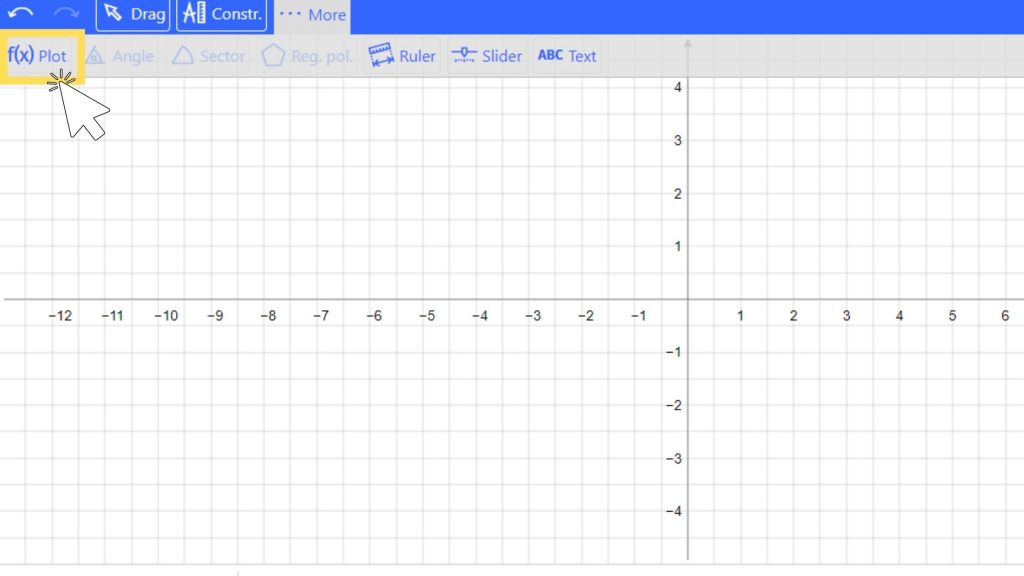
In order to plot a point, just click on the grid where you want the point to be and it will appear there. You can create a scatterplot the same way by creating multiple points.
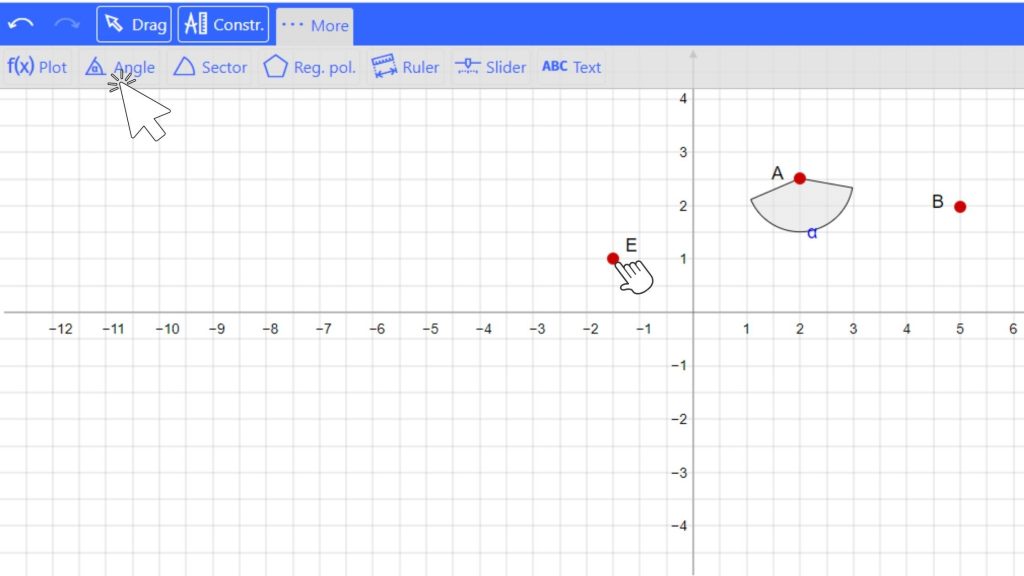
Whenever you wish to construct an angle between the vertices, click on the angle icon, then select the vertices and the angle will be created for you.
Both, plotting points and constructing angles are very easy to do in Sketchometry.
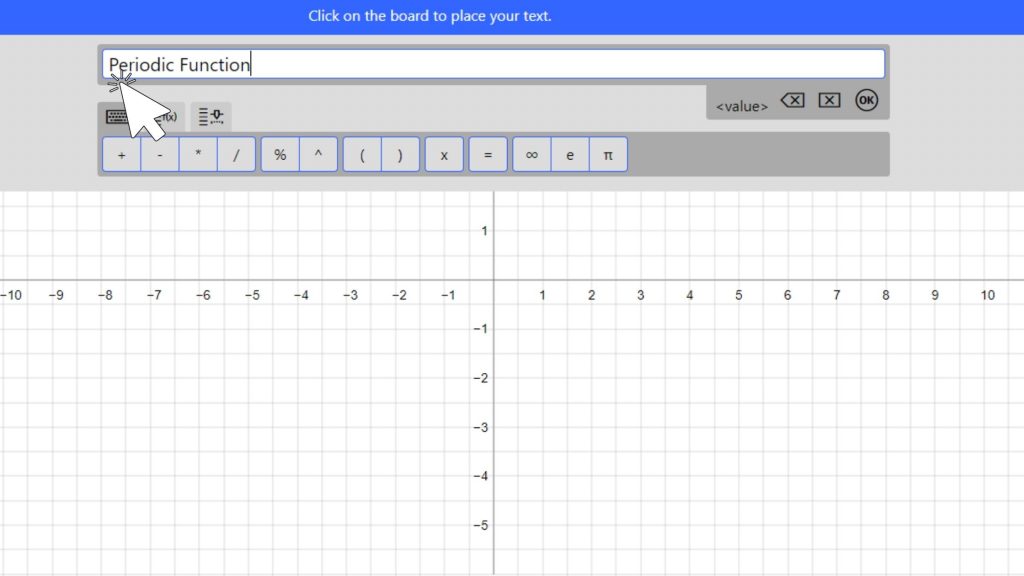
In order to add text to anything on your grid just click the “ABC text” icon and type in the box that pops up. Then, press ok and it will show up on the grid.
Now, let’s go over how to graph a function.
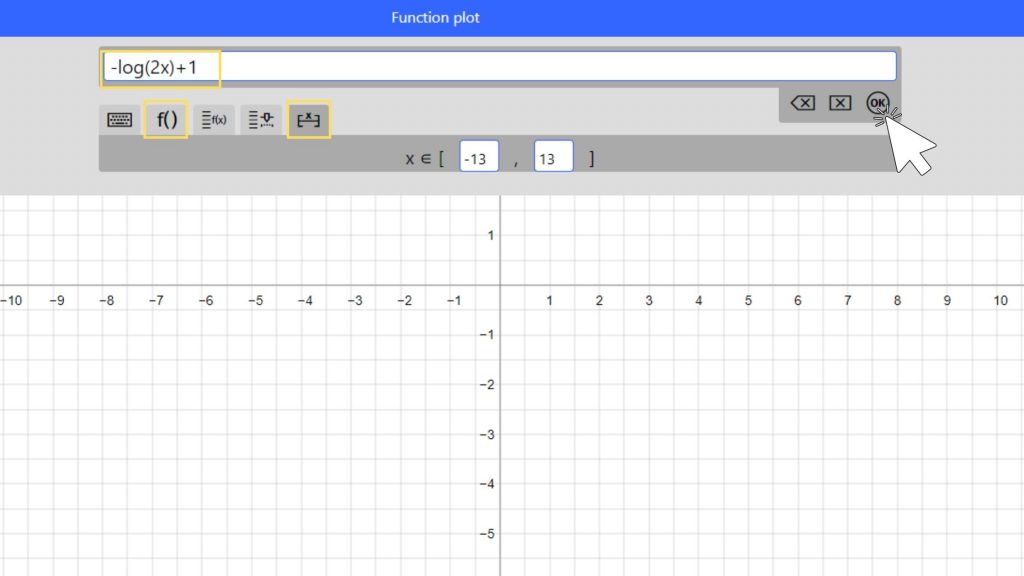
Click on the “f(x)” icon and a window will pop up. In that window first click the “f(x)” to select function type and modify the equation. Do not include the “f(x)” symbol in the input window.
In order to adjust domain of the graph, click on the “x” icon and set your values.
Once you have created your input and adjusted all of the values, press “ok”.
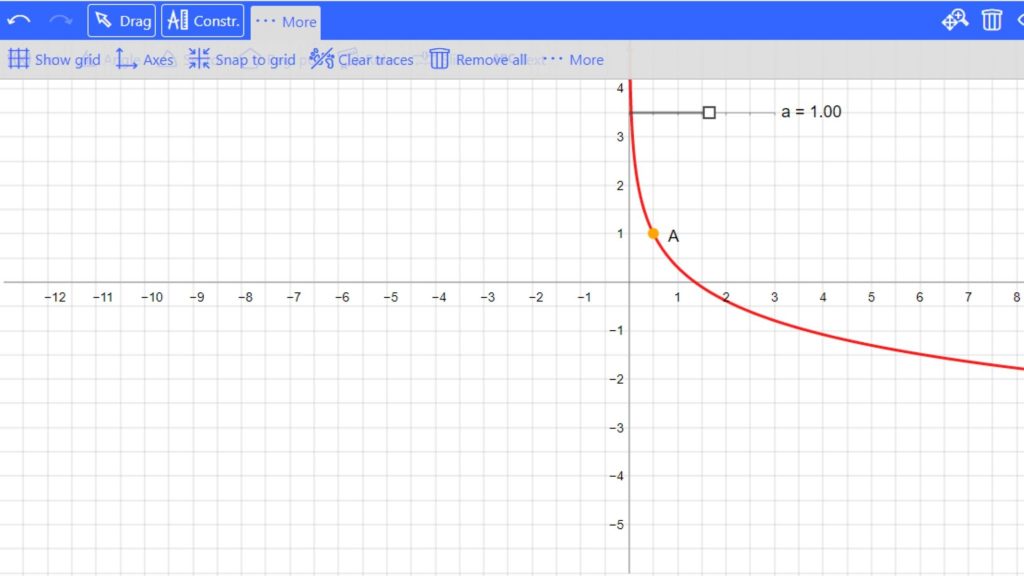
The graph of the function will show up like the one below. You can add sliders and points to it. You can also keep or remove the grid, keep or remove axes etc.
Once finished, all of your files are automatically saved and the next time you use Sketchometry you will be able to access them.
Sketchometry is a wonderful tool that is compatible with a variety of devices and makes online math learning so much easier, fund and very interactive. It is a great tool for a Geometry, Analytic Geometry or a Trigonometry class (there are some worksheets provided in the “Teachers” section). Teachers can use it when explaining the relationships between sides and angles, as well as when working on word problems that require students to draw diagrams.
There are no comments yet