As the weather gets warmer and you go out for a walk, look out for math around you. Observing math in real life helps us understand it better and make connections to what we learn.
It is always fun to apply your knowledge of fractions, rates, trigonometry to something that is real.
The “Caterpillar Math” lesson is a very good example of how math can be found in everything. It is even difficult to call it a lesson, because it is so much fun to observe the creature :).
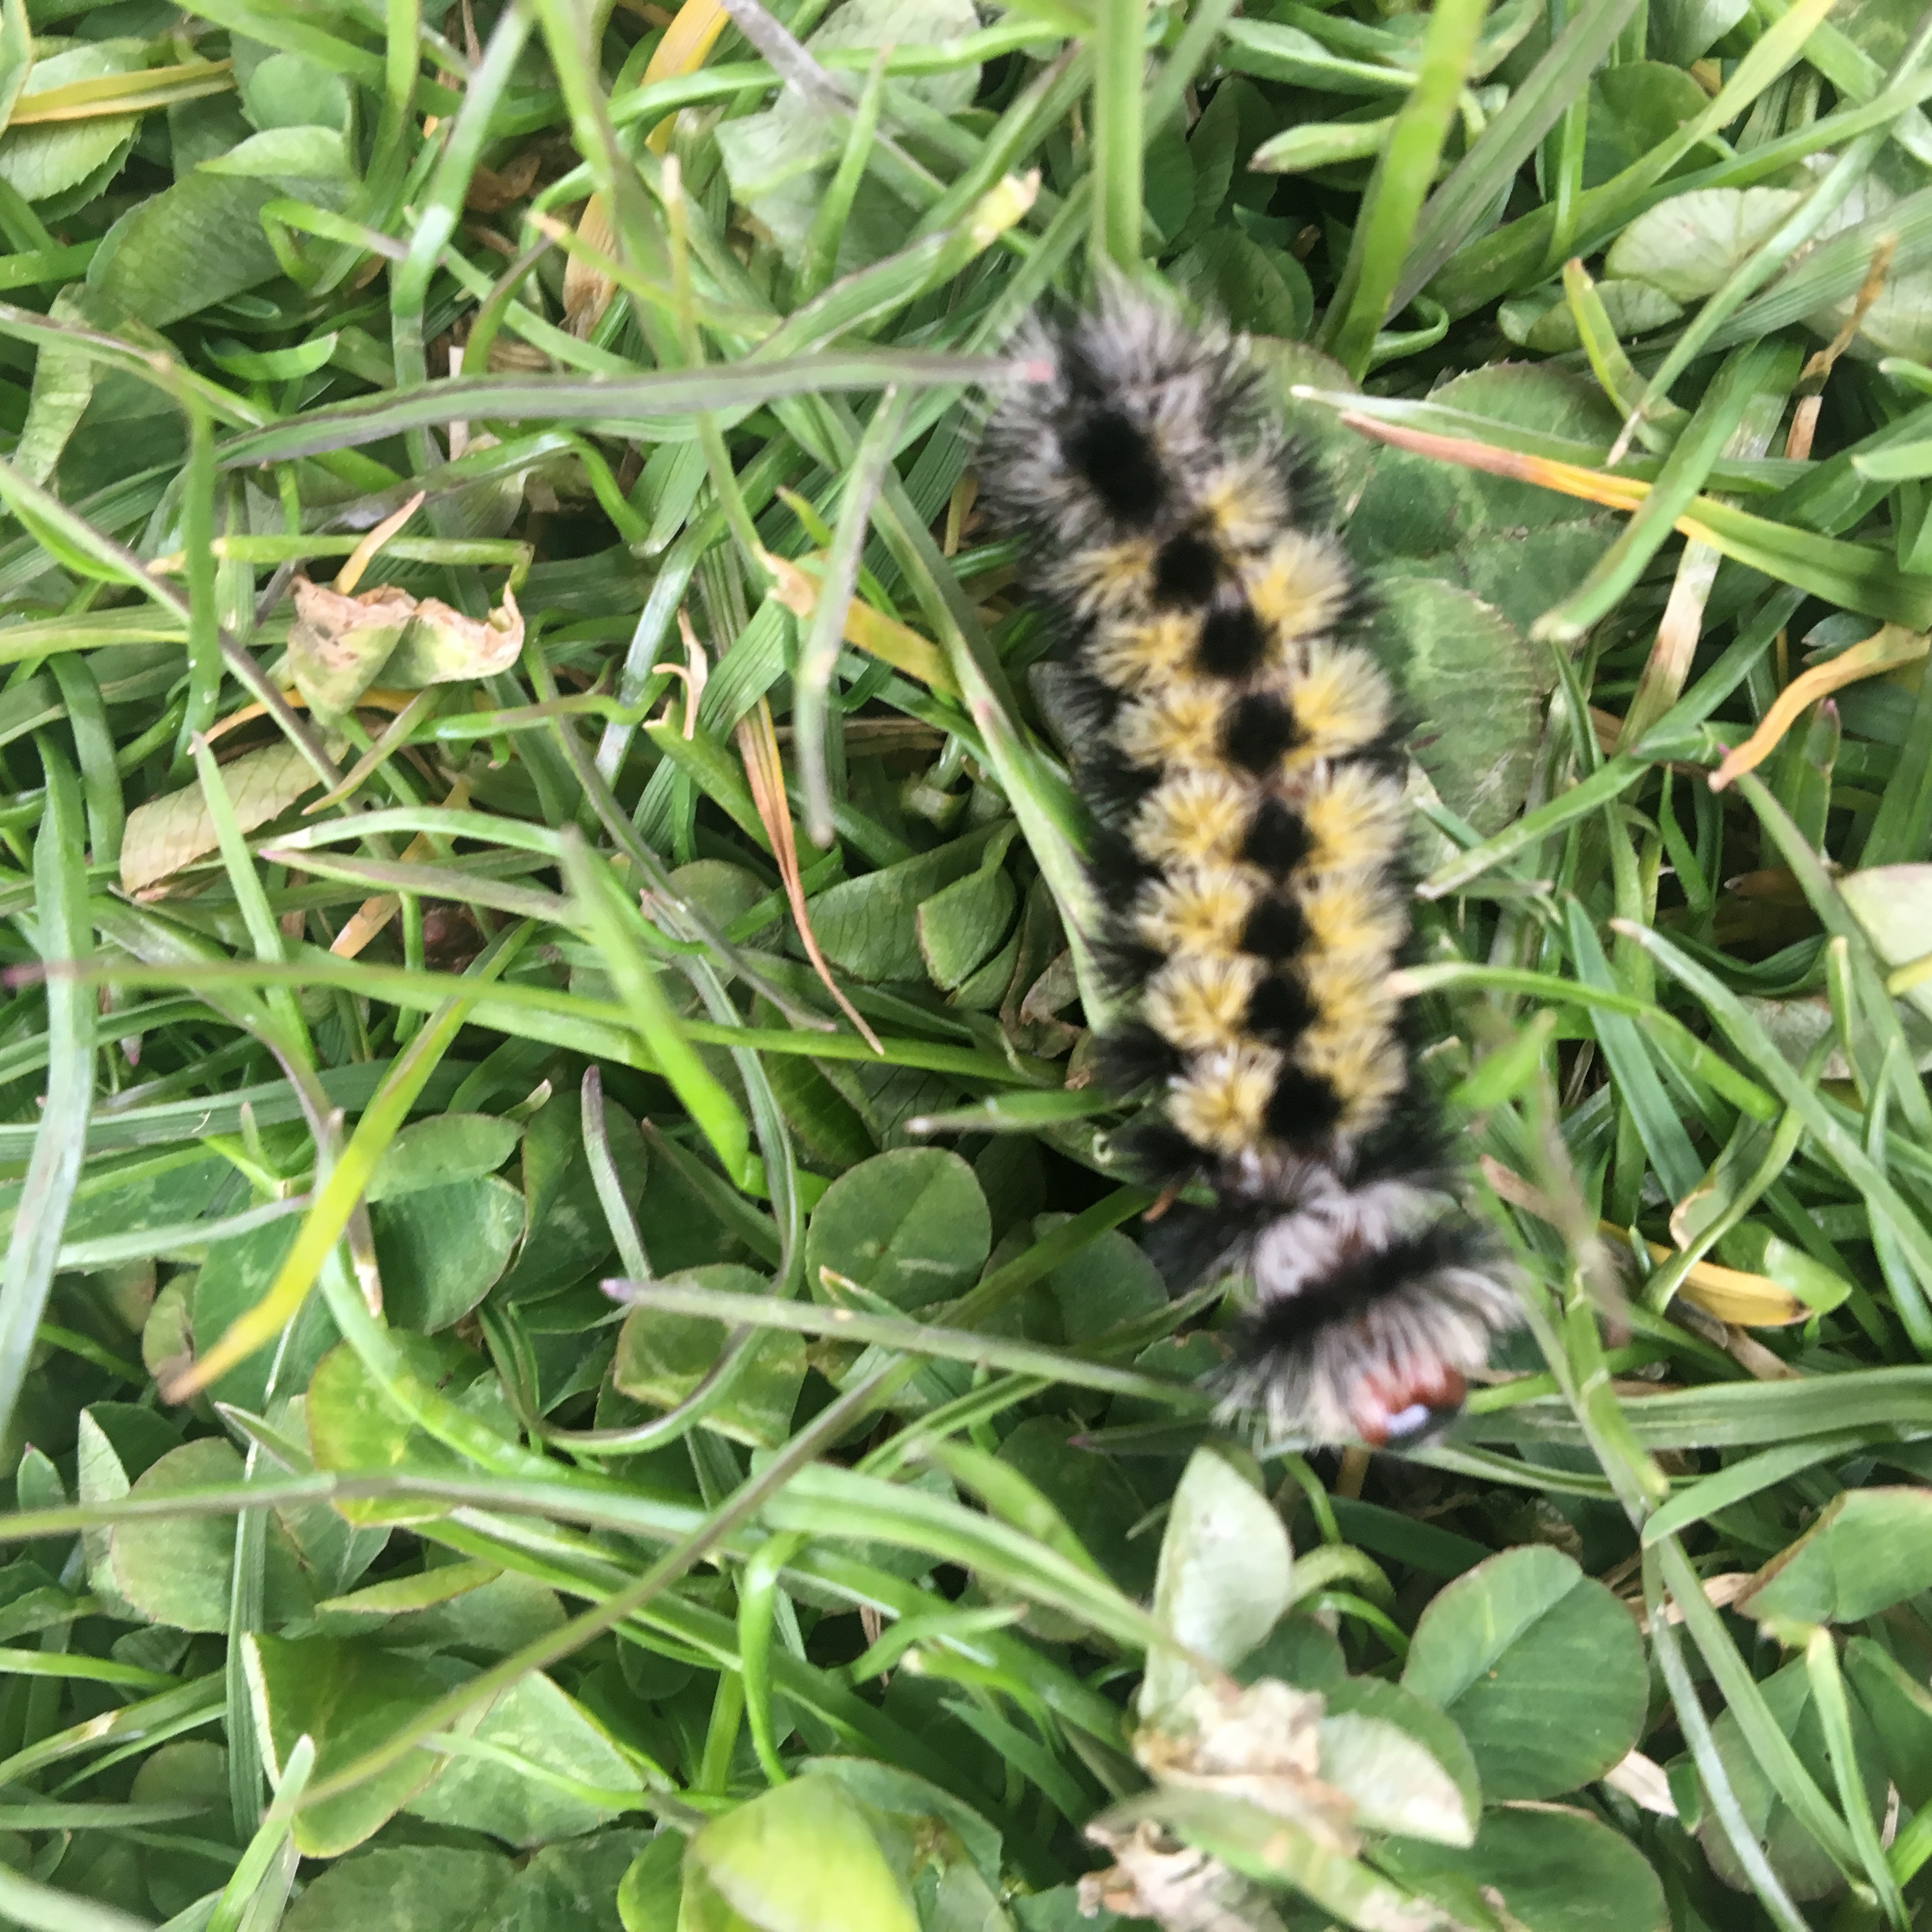
The speed of a caterpillar
Caterpillars move rather slowly by human standards. The normal speed of a large caterpillar (like the one in the picture) is about 1 cm/sec. But when escaping a predator, it can crawl even faster horizontally, as well as vertically.
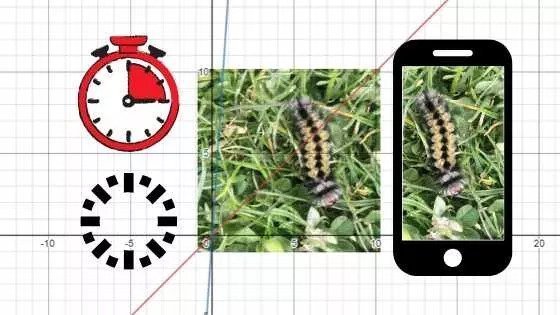
The time lapse feature on a phone camera allows users to significantly speed up the recording. Thus, a caterpillar would be moving so much faster. For example, a recording that is less than 10 minutes long originally would be 15 times faster when time lapsed.
Using math to compare the speed
Now, let’s see how we can demonstrate the difference between the real and the time lapse speed of the caterpillar using algebra and graphs.
So, assuming a caterpillar is moving at a constant speed of 1 cm/s, the equation that would describe its movement would be d = 1t, where d is the distance covered by the caterpillar in centimeters and t is the time that has passed in seconds.
The time lapse is 15 times faster. Making the constant rate of change of the distance relative to time 15 times greater: d = 15t, where d is the distance covered by the caterpillar in centimeters and t is the time that has passed in seconds.
Now, let’s use Desmos to graph these two relationships.
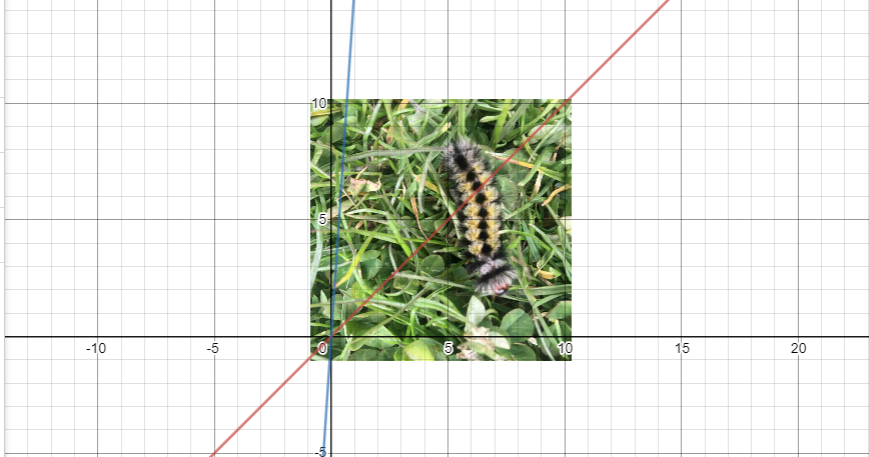
From the graphs it is obvious that when the line representing the relationship between time and distance is steeper, it means higher speed.
Also, it is clear from the graphs that both relationships are direct proportions and direct variations. As time increases, distance increases and both graphs start at the origin – when time is 0, distance is also 0.
Think of some other creatures or objects whose speeds could be compared and analyzed in the same way. Create equations and graphs. Observe more math in real life.
There are no comments yet