Lesson 7: Calculating the Mean. Pie Graph. Bar Graph
In this lesson you will learn what a mean is.
You will discover how the mean is related to the average.
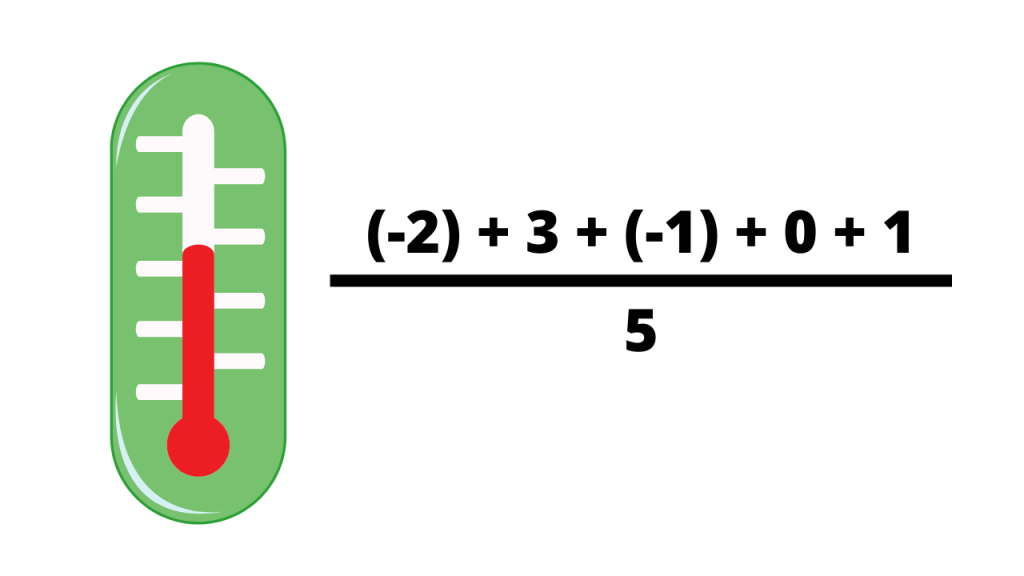
For example, given a set of numbers: 2, 5, 7, 7, 8 the mean is calculated by first finding the sum of all numbers and dividing the sum by how many numbers there are in a set: (2 + 5 + 7 + 7 + 8)/ 5.
The mean is often used in research, academics and in sports.
The lesson will also teach you how and when to use pie graphs (charts). You often see these graphs used by media to show the relationships between various quantities ( for example, during the elections, bar or pie graphs are used to show the ratings of the candidates.
You will learn how to use bar graphs when representing the relationships between quantities that are not dependent on each other.
Grade 8 Mean and Graphs Quiz