
Math is a powerful tool that can help us interpret the information from the past in order to predict the trends, predict the future. Learning history through math can be fascinating.
Statistics is the branch of mathematics that has to do with data collection and analysis.
Information is being collected, organized, compared, graphed and analyzed. Trends are being observed and outliers (anomalies) established.
Every time we want to establish a relationship between certain quantities and phenomena, we can create a table of this relationship and graph it.
For example, we want to see the relationship between how many hours students spend studying for a math evaluation and how well they do. We collect the data and put it in the table like this:
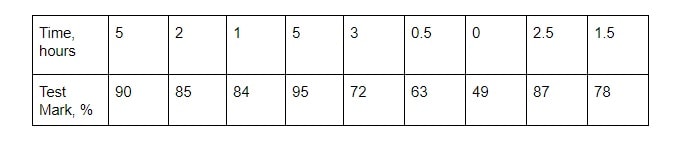
Then, we represent the data graphically using a Scatter Plot – plotting each set of relationships as an ordered pair of a point on a two-dimensional Cartesian Plane, like this:
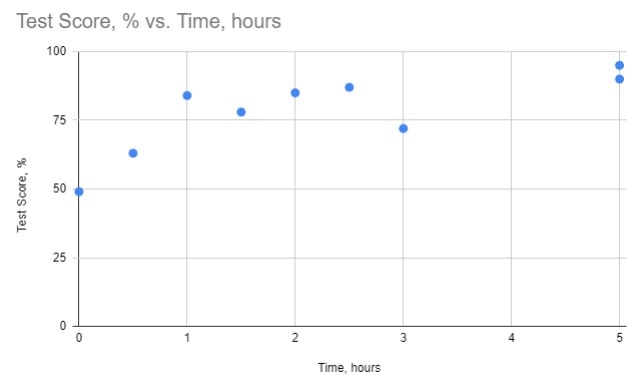
By looking at the scatter plot (or drawing the line of best fit through the points), we can observe a rather obvious positive trend: the more a student studied, the better they scored on the test. The relationship does not form a perfect straight line, which means that study hours could vary slightly, but the positive trend would still be observed. There are also no obvious significant deviations from the trend – outliers, where no studying, for example, would help a student score the highest on the test.
Now, what does all of this have to do with History??? What does it have to do with learning history through math?
History can be studied in terms of many different relationships. We can look at how much money people were making at different countries at different times in history and discuss why that was the case. We could also compare how education and industrialization were related.
Or how about we consider the relationship between Life Expectancy and Income and see how this relationship was changing in different countries overtime?
With the help of an online statistical tool Gapminder World we will be able to see how long people used to live and how much money they were making in different parts of the world.
Let’s go back to the year 1900.
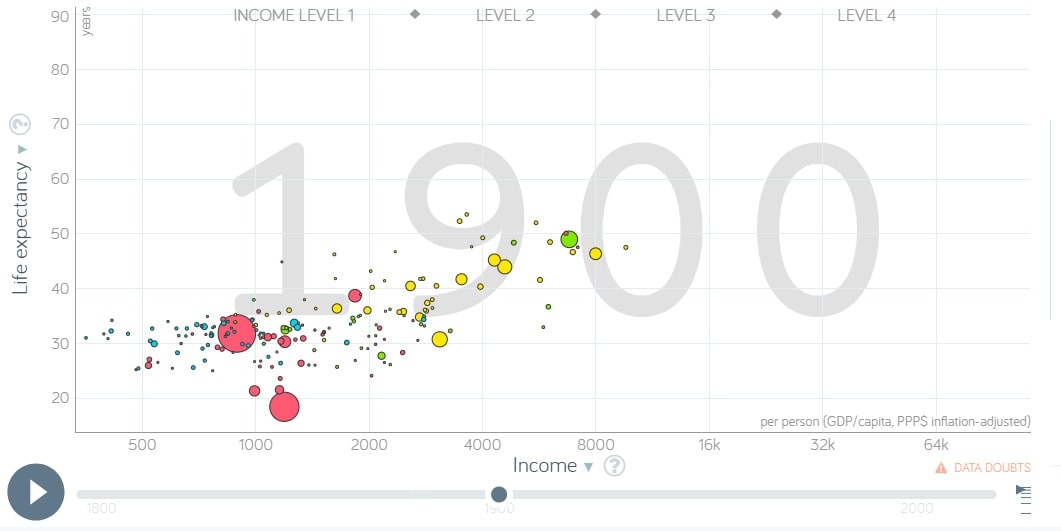
The above scatter plot from Gapminder World shows how countries ranked based on their life expectancy and income in 1900. People lived the longest in Norway (53.5 years) and had the highest annual income per person in Switzerland ($9,630). The lowest life expectancy in that year was in India (18.4 years).
Now, let’s select one country – Ukraine – and observe its trend within the same parameters of life expectancy and GDP per person between the years 1900 and 1944:
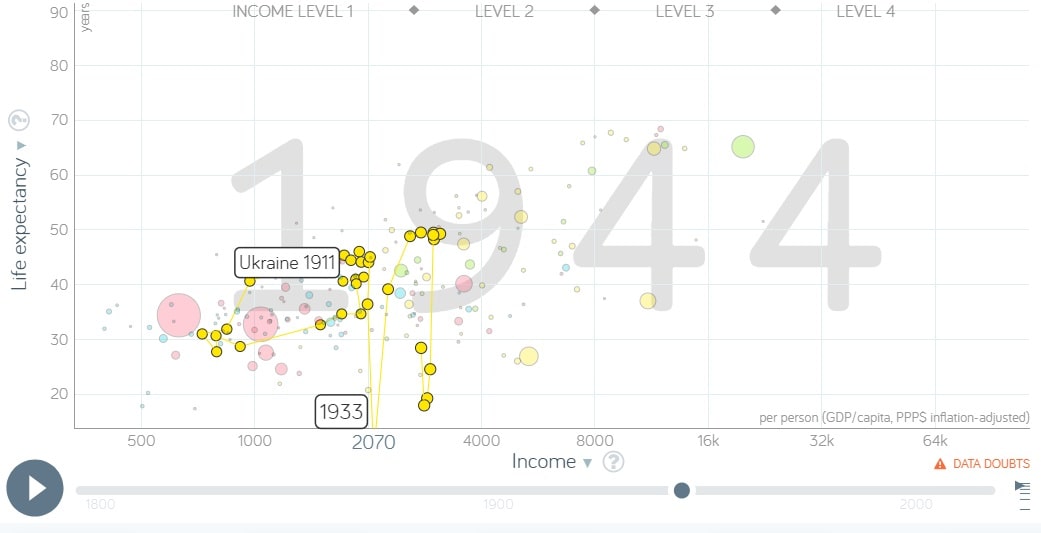
As we can observe, in 1932 – 33 the life expectancy in Ukraine has dropped to “0”.
Then, after recovering for a bit, it went down again. Those points are called “outliers” as they do not fall under the general trend and stand out. But why would it happen?
This is a great opportunity to take a look at the historic events that could potentially cause such a drastic drop.
In 1932 – 33 the Soviet Regime has conducted a mass confiscation of wheat and food from the rural population on the territory of the Soviet Ukraine. As a result of this artificial famine – genocide millions of Ukrainians perished (many of whom were children). This man-made starvation also became known by the Ukrainian word “Holodomor” (means “deliberate starvation”).
In 1932 World War 2 started and many Ukrainians were killed fighting the German invasion, thus the life expectancy went dropped significantly again.
Numerical and graphical representation of the relationships between quantities and phenomena helps us identify the causes and the effects of past events and, if properly analysed, prevent tragic things from happening in the future. Mathematics goes hand in hand with many disciplines, serving as a reliable foundation for something that could not be established or proven otherwise. Learning history through math can help avoid mistakes in the future.
One thought on “Learning history through math.”